
About the Plan
Why Oregon needs to reduce greenhouse gas emissions from transportation
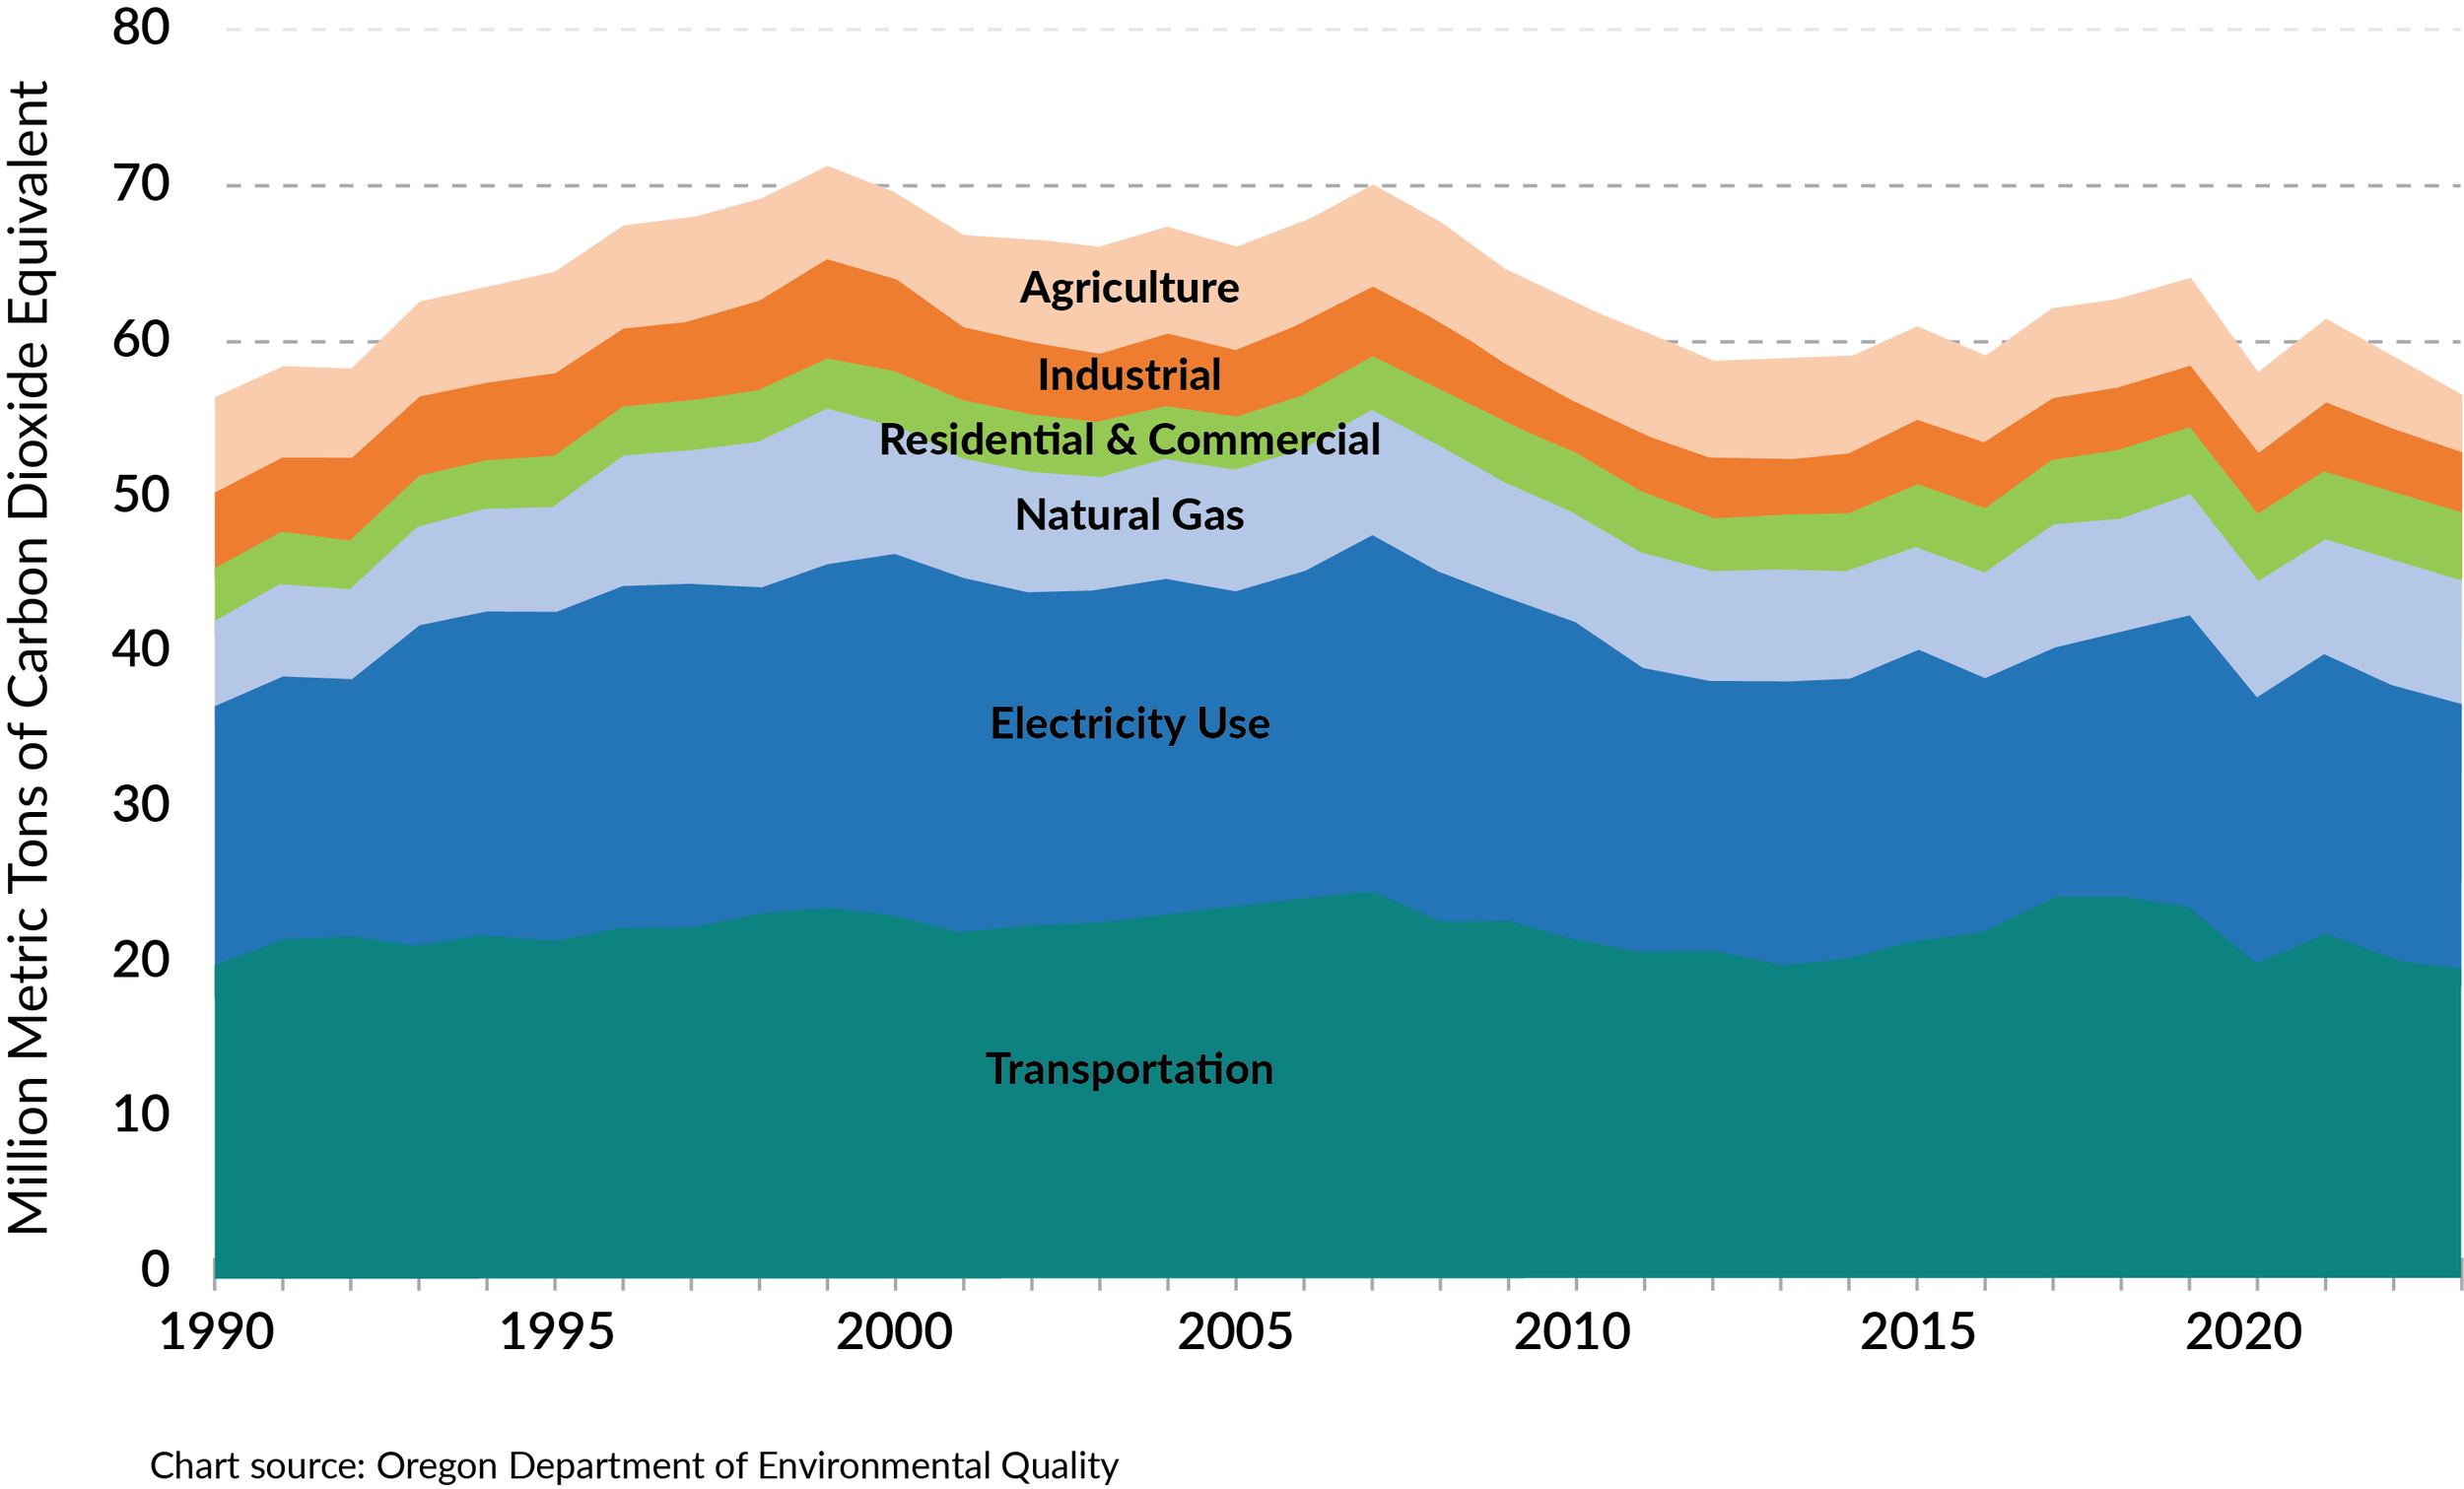
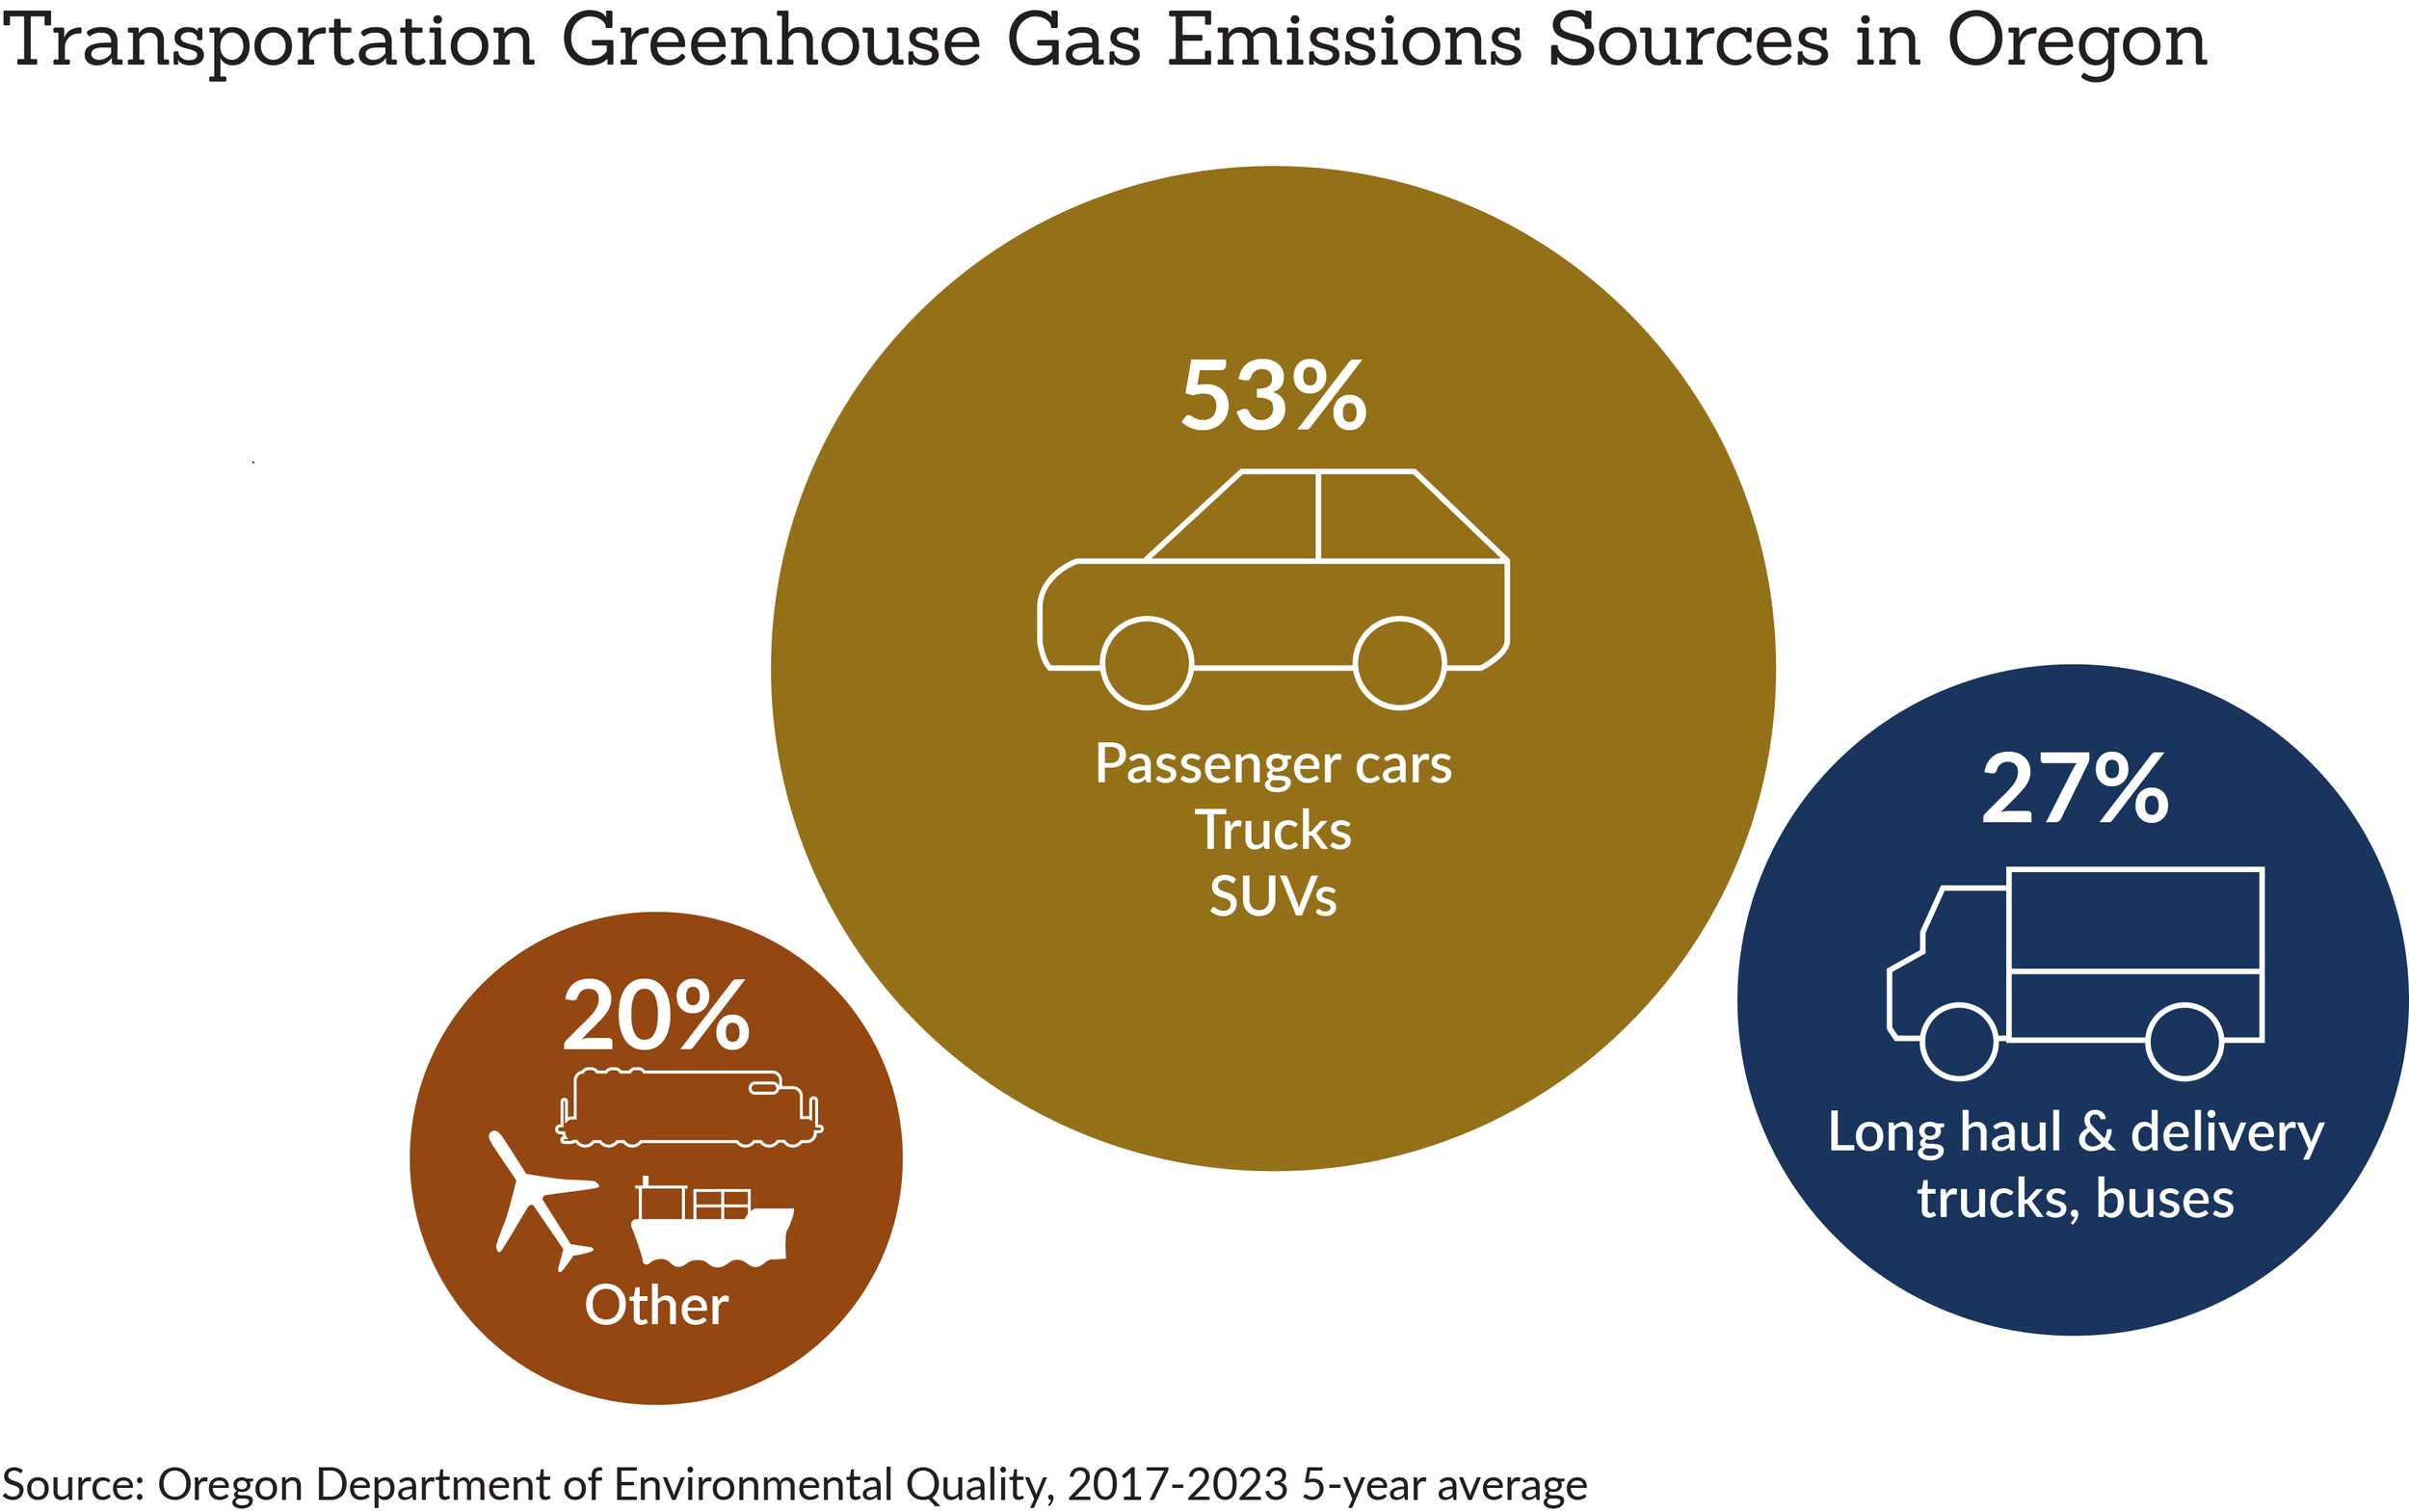
Greenhouse gas emissions are a key contributor to human-influenced climate change. In Oregon, greenhouse gas emissions from transportation are about 35% of total emissions and represent the largest sector of emissions.
In response, the Oregon Departments of Transportation, Energy, Environmental Quality, and Land Conservation and Development are working together, with federal, state, local, private industry and individual partners, to reduce emissions from transportation to 80% below 1990 levels by 2050.
The four agencies will periodically update this website to report on Oregon’s progress to reduce transportation emissions. Contact Us to provide feedback.

Oregon’s emission reduction strategy
The Statewide Transportation Strategy: A 2050 Vision for Greenhouse Gas Emissions Reduction is Oregon’s roadmap to reduce emissions from the transportation system. The strategy examines all aspects of the transportation system including the movement of people and goods, vehicle and fuel technology, urban land use patterns, and outside market forces. It contains key actions that agencies, private industry, and people in Oregon can take to reduce emissions from transportation through the year 2050.
The strategy called for a 75% reduction in emissions to help achieve the state greenhouse gas emissions reductions goals set by the Oregon Legislature. The original analysis of the strategy found that 60% emissions reduction for all vehicles and up to 80% emissions reduction from just passenger vehicles was feasible.
In 2020, Governor Kate Brown issued Executive Order 20-04. The order revised the emission reduction goal to 80% below 1990 levels by 2050.
Oregon state agencies have built on the Statewide Transportation Strategy for the last 15 years, and are working within their authority under various programs, policies, and regulations to reduce emissions from transportation.
See the Progress page for our recent shared progress towards the 80% reduction goal.
Each agency is working toward the common 80% reduction goal. That goal created two objectives, and those two objectives are driven by actions in six transportation categories.

One Goal
Reduce emissions from transportation to 80% below 1990 levels by 2050.
Two objectives
Reduce growth in vehicle miles traveled
Vehicle miles traveled is a measurement of how many driving trips people take, and how far they drive each trip. Every vehicle trip by people in Oregon produces greenhouse gas emissions. Oregon state agencies use several methods to reduce growth in vehicle miles traveled: Strong land use laws, encouraging and investing in non-driving options, pricing policies and incentives, and maintaining an efficient transportation system.
Categories that drive this objective are Land Use; Transportation Options; System Operations; and Pricing, Funding and Markets.
Clean up each vehicle mile
“Clean” vehicle miles produce low or no greenhouse gas emissions. Oregon state agencies build on federal regulations, programs and incentives to encourage new technology that reduces emissions from the types of vehicles people drive, like electric, and the kinds of fuels used to power those vehicles.
Categories that drive this objective are Vehicle Technology, Fuel Technology, and System Operations.


How we collect data and how we track progress
Data are gathered from federal, state and local governments, and commercial sources. State agencies have been tracking some data for decades, while other data are relatively new, or have undergone updates or definition changes. Industry partners can provide valuable data resources, too.
The key to understanding how state agencies use data to track Oregon’s progress is knowing the distinction between “measurement” and “forecasting.”
Measurements establish baselines and identify trends over time. Some things can be easier to measure directly — like the number of registered electric vehicles each year — while others are more difficult, like the amount of greenhouse gas emissions emitted from transportation projects.
For measurements that are harder to measure directly, state agencies gather other data to help them make accurate estimates. This includes data like vehicle miles traveled, household travel behavior, walking and biking trips, transportation demand management program participation, and others.
Many of these measurements are available to the public. For example, public EV charging stations and vehicle miles traveled are tracked on ODOT’s State of the System website. Multiple agencies contribute to Oregon’s EV dashboard.
Once state agencies collect measurement data, they can use them for forecasting.
Forecasting looks to the future and helps set long-term goals. State agencies use mathematical models, which combine current data and past trends, to help them understand where Oregon could be in the future. All forecasts are subject to uncertainty because the future is unknown. As time goes on, agencies gather and measure more data, and their methods and measurement tools improve. This translates to more accurate forecasting models.
ODOT uses (and helped create) a model called VisionEval to forecast Oregon greenhouse gas emissions from transportation. VisionEval is a long-range strategic planning tool that forecasts how community development and transportation investment choices could influence progress towards the state emissions reduction goal and other community livability outcomes. Learn more about how VisionEval works.
Measurements and forecasting work together to help Oregon set a vision for future outcomes. State agencies measure against this vision at regular intervals to see how they’re doing, and make necessary adjustments when needed.
Sharing information is the final step. This website measures progress towards our vision in two ways:
Report cards – These qualitative assessments were developed in consultation with subject matter experts across multiple agencies. They provide progress scores for 2026 and 2050, relative to where our vision says we need to be in those years. Programs, investments, funding sources, regulations and requirements, which are precursors to seeing results on the ground, are important in report card progress. The circles represent progress; a more filled-in circle means we’re doing better. In many cases, we can have a good current grade but need further improvement to achieve that same grade in 2050.
Progress charts – These forecasts come from Oregon VisionEval modeling and compare current trends and financially constrained adopted plans and trends against the future Statewide Transportation Strategy vision for 2050. Progress charts include current progress on the ground, as well as progress estimated from future plans and funding. The Oregon Department of Transportation leads the VisionEval forecast process and relies on expert review and input from local and state partner agencies to produce good forecasts, based on what we know today and future uncertainties. Additional information on the model assumptions is available on request, please Contact Us.
The role of government, private industry, and the public

Reaching Oregon’s 2050 emissions goal will take a collaborative effort between local, state and federal government, Oregon’s business community, and people in Oregon.
State, local and federal governments can strive to provide transportation choices that are low or no emission. Active modes of transportation, like walking or biking, should be as attractive, convenient, and accessible as driving in many areas across the state. Governments can also pass legislation, offer incentives for consumers, and enforce regulations to curb emissions.
Oregon’s private industry works within state and federal laws and regulations to advance cleaner vehicle and fuel technology, develop affordable low-emission transportation options, and more.
People in Oregon can do their part by making climate-friendly choices. For some people, that may mean buying an electric car as their next vehicle. For others, it may be choosing to walk to work. Even taking the time to comment at a government public meeting, and supporting the actions on this website, can have a positive effect.
How reducing emissions will make Oregon better

Household savings
Enabling opportunities to walk, bike, roll, and take transit will lead to fewer personal vehicle trips and less money spent on vehicle maintenance, gas, tolls, and other costs. Many non-driving options also encourage a healthy lifestyle, and fewer cars on the roads will keep Oregon’s air cleaner. Healthier people means lower health care costs, too.

Safe and reliable roads
Building new roads or updating existing ones with non-driving modes in mind, like walking/rolling or biking, translates to a safer experience for all road users. A safer experience means fewer crashes, which creates a more reliable trip for all road users.

Stronger economy
Investing in infrastructure and incentives that spur a transition from fossil fuel options like gasoline and diesel to low emission fuels can help insulate Oregon’s economy from instability in the global energy market. It will also create new jobs in sustainable fields for people in Oregon.
The state’s economy will also benefit from the forward-thinking land use policies. As Oregon’s population and economy grows, state and local policies will ensure people, goods and services can move efficiency through Oregon’s communities.

Cleaner environment and healthier communities
Advancing the shift to vehicles and fuels that release less greenhouse gas emissions results in cleaner air, better quality of life and healthier communities. Plus, with Oregon less reliant on fossil fuels, that means negative environmental impacts of resource extraction — like drilling accidents or spills during transport — are less likely.